Is your BDS having an impact?

We at The Complicity Index primarily look at 3 metrics:

(I) Revenue (II) Gross Profit Margin & (III) Share Price – from financial year 2022 (before 7 October 2023) to 2025, across 3 full financial years.

Revenue: whether revenues have risen or fallen, over a 3-year period.

Gross Profit Margin: Useful indicator whether boycott is hurting the company (although there can be many non‑boycott reasons for a falling GPM as well)

share price: If a company’s profit outlook remains unclear, share price will typically fall.

When combined, we can see which company is hurting bad, barely surviving and which companies are growing unhindered, despite the BDS (boycott, divest and sanctions) movement.

For a complete list of 176 companies, please click here.

A large, ultra-modern trading floor without any people, dominated by a massive curved wall of screens showing complex financial dashboards. Deep red and muted orange line graphs slope sharply downward, overlaid on clean dark interfaces with subtle gridlines and numeric columns. A sleek, reflective black glass desk in the foreground holds a high-end monitor displaying a clear multi-panel view of falling share price, declining quarterly revenue, and compressing gross margins. Cool, diffused overhead lighting creates soft reflections on polished surfaces, with a low-contrast, professional mood. Photographic realism, shot from a slightly elevated wide angle, sharp focus throughout, conveying analytical rigor and the idea of a systematic index of struggling companies rather than generic stock imagery.
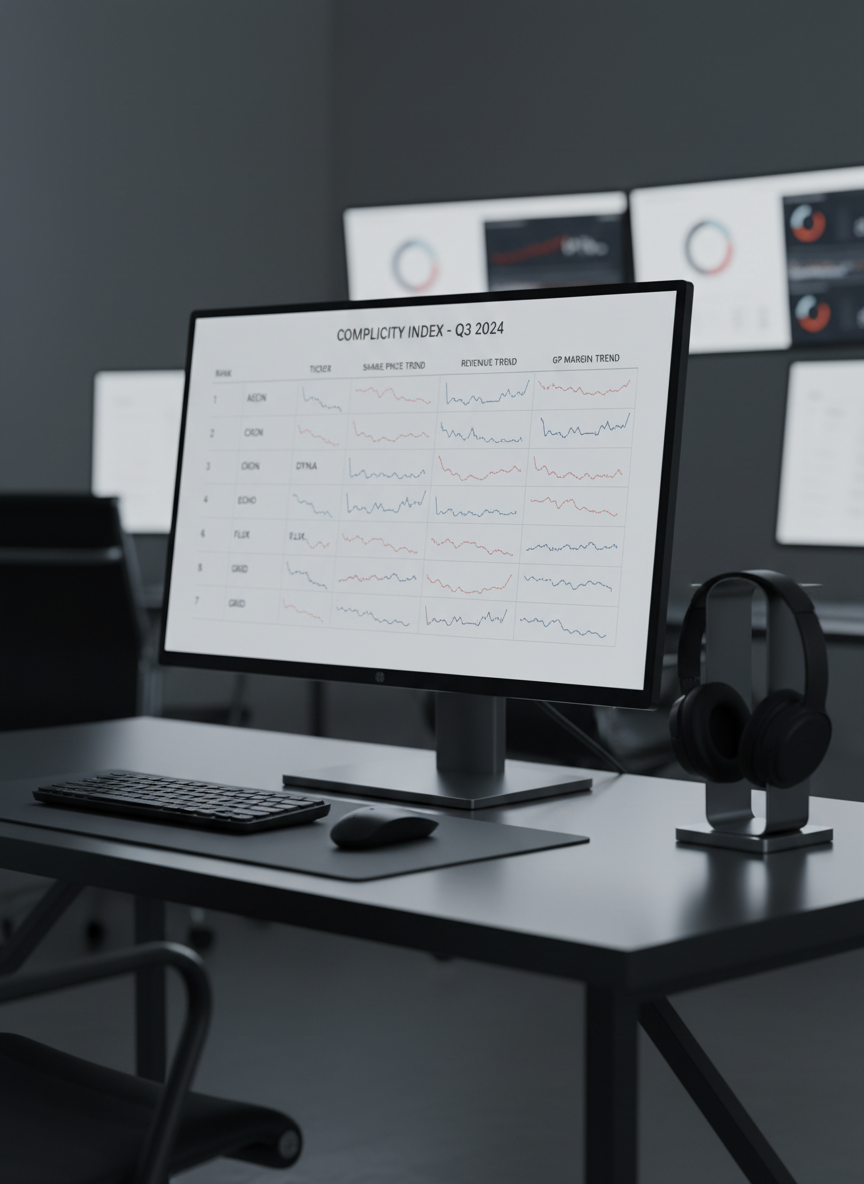
A close-up, photographic view of a minimalist, dark metal desk setup in a quiet office, centered on a high-resolution monitor displaying a ranked table of anonymized company tickers. Each row features small, clean sparkline charts sloping downward for share price, revenue, and gross profit margin, with subtle color accents in reds and desaturated blues. The background shows additional blurred monitors with similar analytical layouts, not recognizable as real brands. Cool, neutral studio-style lighting from the side creates gentle highlights on brushed metal surfaces and casts soft shadows, giving a calm, highly professional atmosphere. Shot at eye level with shallow depth of field, emphasizing the precision and seriousness of the Complicity Index’s ranking and analysis.

About

The Complicity Index is a vetted list of 176+ global companies and entities that ought to be boycotted for either operating in Israel despite the ongoing genocide, or providing material support or supplies to the IDF or Zionist Israel.

Each name is thoroughly vetted. To verify evidence and original source of information, click here.

We are however not about simply providing a list of companies to boycott. Instead, our sole purpose is to help you see whether your boycott is having a financial impact on these companies.

Services

An abstract but photographic office environment featuring a transparent acrylic model of a city skyline on a matte black table, where several clear tower-like blocks are partially melted or visibly shrinking. Subtle, holographic-style financial overlays float above the buildings, showing red downward arrows, bar segments receding, and thin revenue and margin lines curving lower, all stylized without text or real logos. Cool white directional lighting from above and behind creates crisp reflections and elongated shadows across the table’s surface, adding depth and drama. Captured from a low, cinematic angle with a focused foreground and slightly blurred background, the mood is analytical, sober, and forward-looking, symbolizing companies losing financial stature within a structured index.

Design and maintain ranked indices tracking share-price, revenue, and margin declines across global listed companies.
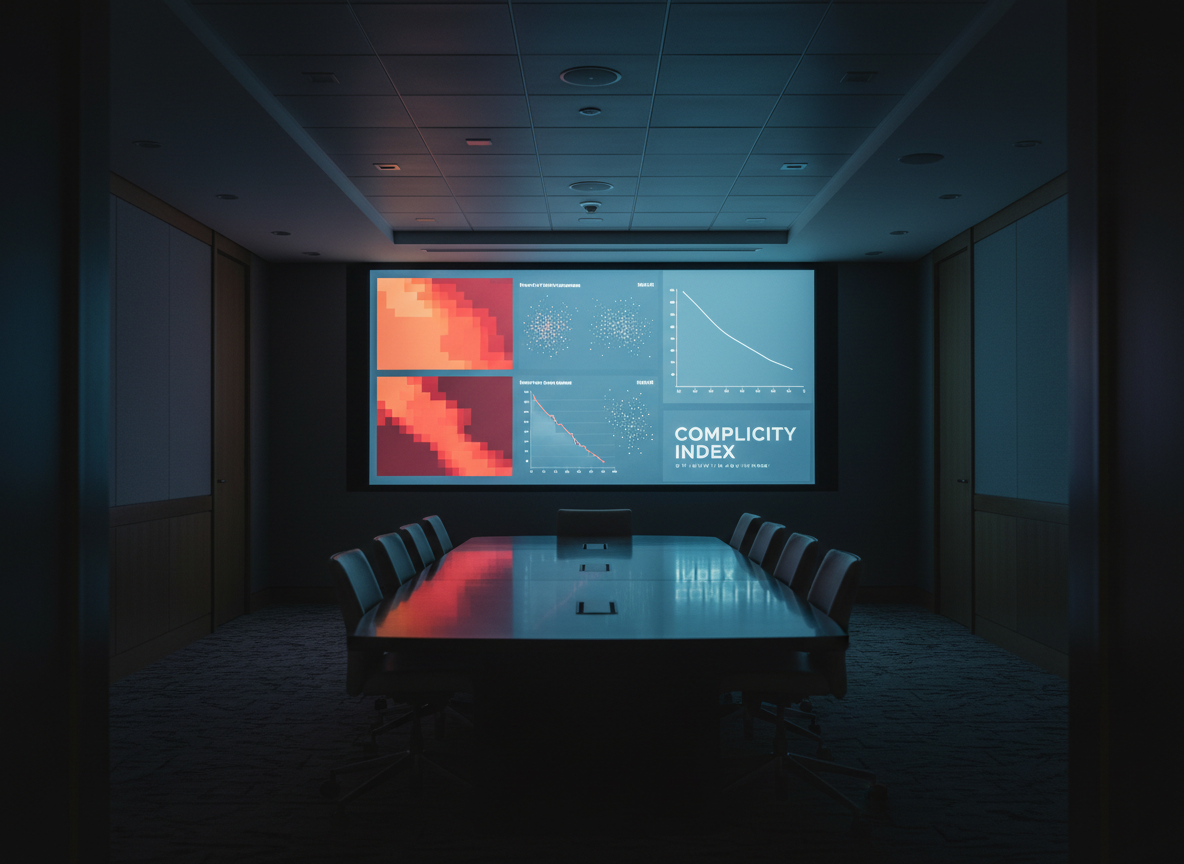
A dimly lit conference room with a long, dark wood table and a large wall-mounted display at the far end, showing a multi-panel dashboard dedicated to distressed companies. One panel features a heatmap of sectors fading from dull orange to deep red, another shows clustered scatterplots of declining margins versus revenue drops, and a third displays an index curve trending lower over time. All visuals are stylized and data-centric, avoiding identifiable brands or text. Soft, cool overhead lighting and a subtle glow from the screen illuminate the room, creating a focused, contemplative mood. Photographic realism, shot from the doorway with a central vanishing point down the table, highlighting the seriousness of strategic analysis around the Complicity Index.

Provide interactive tables, filters, and search tools for rapid screening of underperforming companies by metric and timeframe.

A high-contrast, photographic macro shot of a printed analytical report lying on a slate-gray surface, its pages slightly curled. The visible page shows a clean, minimalist layout: a bold downward-sloping composite index line, three smaller charts for share price, revenue, and gross margin, and a series of neutral, anonymized bars ranked from left to right, all rendered with restrained reds and cool grays. A sleek metal pen rests diagonally across the page, and in the soft-focus background sits a tablet displaying a similar dashboard. Natural, diffused window light from the left creates gentle highlights on the paper’s texture and pen, with subtle shadows adding depth. The mood is meticulous, data-driven, and quietly urgent, ideal for conveying in-depth company index analysis.

Aggregate, normalize, and validate multi-source price and fundamental data to support accurate, comparable decline metrics.

A nighttime cityscape seen from a high-rise office window, rendered in photographic realism, where the lights of skyscrapers subtly form downward-sloping patterns reminiscent of declining graphs. In the foreground, inside the office, a minimalist black desk holds a laptop open to an intricate, text-free visualization of an index: interconnected nodes representing companies, with the dimmer nodes linked to lines trending downward for revenue and margins. The laptop screen casts a cool blue glow on the matte desktop, while scattered reflections from the city lights shimmer on the window glass. Soft, low-key interior lighting maintains a contemplative, analytical atmosphere. Shot from slightly behind and above the laptop, with the city softly blurred, highlighting the concept of mapping corporate decline across a complex economic landscape.

Generate consolidated analysis on red-marked companies, highlighting cross-metric weakness without offering investment advice.

Insights

Get index updates in your inbox

Visit us

123 Example StreetSan Franciso, CA 12345

Hours

Monday–Friday 9–5

Phone

(123) 456-7890